

Energy Market Assessment: Needing more oil & natural gas, and a drilling boom.

Monday, March 24, 2025
(Oil & Gas 360) – While prices show bearishness high, activity continues showing UP is the direction we head needing more oil & natural gas, and a drilling boom.
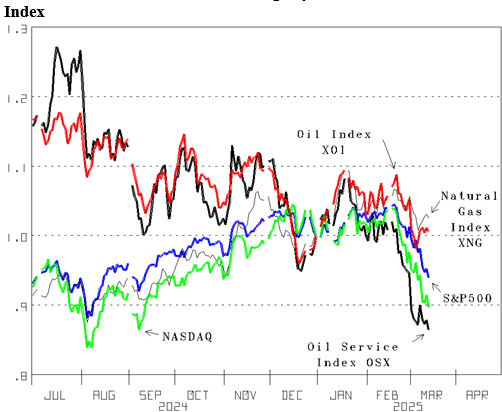
Worries about tariffs and that a recession is where we head is dropping stock and other prices. Uncertainty increasing helped by tariff and Government Shut-Down fears has the NASDAQ down at 17,303.01 today (Figure 1, green line), down 10.4% year-to-date (YTD), and the S&P 500 at 5,521.52 (blue line) down 6.1% YTD. Although the current month futures contract price for West Texas Intermediate (WTI) crude oil is below $67 per barrel, the Oil Index (XOI, red line) is up 0.5% and the Natural Gas Index (XNG, line) is up 2.5%. Nevertheless, the Oil Service Index (OSX, bold line) down 13.6% YTD confirms the pursuit of oil and natural gas actions and expectations are extra low.
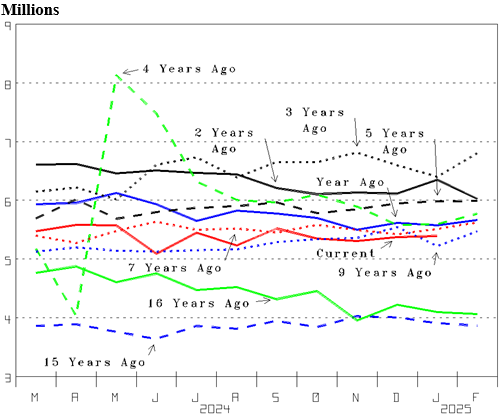
Although recession fears and uncertainty are high, Tuesday’s JOLT report, that 5.393 million were hired in January, highlights a growing economy. Tuesday morning the Job Openings and Labor Turnover Summary (JOLTS) from the U.S. Bureau of Labor showed 5.393 million non-farm workers were hired in January (Figure 2, red line), 19,000 more than in December and 305,000 more than in June. While 5.393 million is well below the levels reached following the big drop to 4.0 million with the Coronavirus Recession in April of 2020 (green dash), it is not showing decline. It is up in economic growth territory.
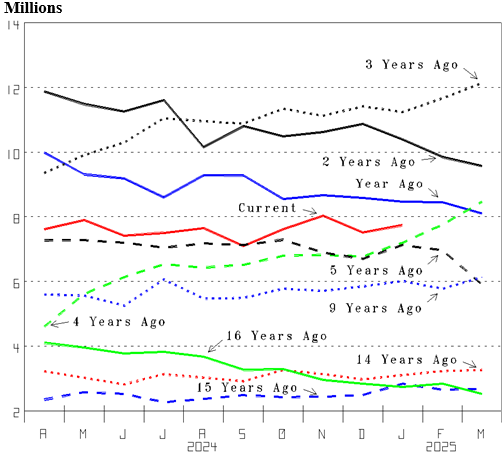
The number of job openings also shows a growing economy. 7.740 million is the number of non-farm job openings in January (Figure 3, red line). While that is well below the 12.0 million level reached with the recovery of The ChinaVirus = Coronavirus Recession dictated (bold dot and bold line), it is an economic growth level sustained since April. The level sustained and it is 2.347 million (43.5%) greater than the number hired (Figure 2) confirms employers see much to be done are seeking employees.
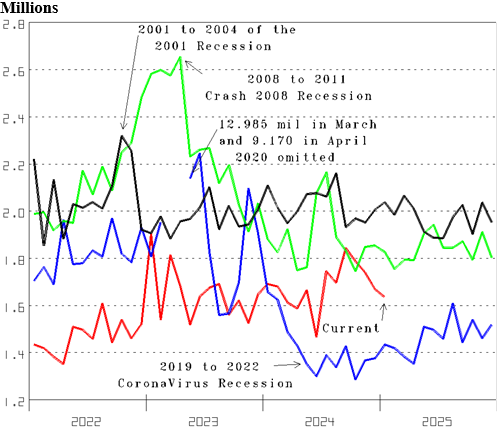
Only 1.635 million workers were laid off or discharged, which is another measure that confirms that the economy is growing. Recessions are the result of activity dropping so layoffs and discharges (Figure 4) increase. The ChinaVirus = coronavirus recession in 2020 (blue line) had layoffs and discharges jump to 12.985 million in March and 9.170 million in April, which we do not show. Layoffs and discharges increased to over 2.6 million with Crash 2008 (green line) and over 2.3 million with the 2001 recession (bold line). We credit interest rates increased for the rise to 1.9 million as 2023 began (red line). However, the economy simply slowed, it did not go into recession. And down at 1.635 million in January, it is clearly in growth territory. Although there is considerable concern about the government workforce being reduced, we predict notable mankind efficiency gains sustain economic growth.
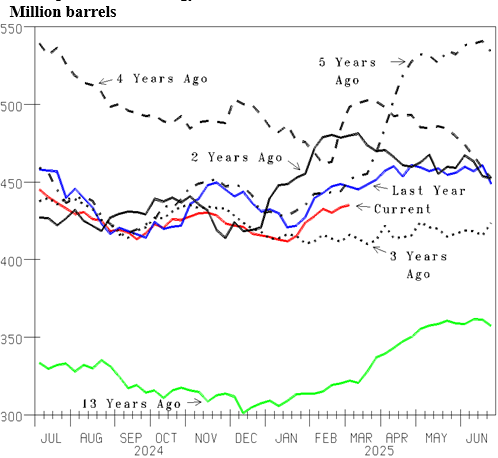
U.S. crude oil inventory increasing since mid-January has been depressing oil prices and increasing recession fears. As we noted in our March 7th Energy Market Assessment, the decline in U.S. commercial crude oil inventory into January (Figure 5, red line) had the spot market price of West Texas Intermediate (WTI) crude oil increase to $80 per barrel as January began. However, the increase since has deflated the price down to around $67, encouraging recession fear.
By oilandgas360.com contributor Michael Smolinksi with Energy Directions
The views expressed in this article are solely those of the author and do not necessarily reflect the opinions of Oil & Gas 360. Please consult with a professional before making any decisions based on the information provided here. The information presented in this article is not intended as financial advice. Contact Energy Directions for the full report. Please conduct your own research before making any investment decisions.

No comments:
Post a Comment